What “Cost per Ready Hour” Actually Measures
A purchase price records one day in the life of an apparatus. Cost per ready hour records every day after it, and staffing and availability discipline shape that number far more than the invoice does. Two departments can run comparable trucks and still end up with ready-hour costs far apart, because one crews every seat around the clock while the other rides short or loses hours to out-of-service time. Computed the same way, that gap can be shown rather than argued about.
The metric itself is simple. Take the recurring cost of keeping one apparatus staffed, fueled and serviceable, and divide it by the hours that apparatus was available to respond. Ready hours count only time the rig is crewed, equipped and fit to roll. Hours in a bay or a repair shop produce no ready hours, but their costs keep arriving.
That recurring total comes from three pools, and each behaves differently as utilization changes.
| Cost pool | What it captures | How it responds to ready hours |
|---|---|---|
| Crew staffing | Wages, benefits, overtime, and minimum staffing cost per seat | Fixed per shift hour; the dominant driver of cost |
| Idle fuel burn | Fuel consumed while stationary: warm-up, pump tests, scene standby | Partly fixed, partly variable; persists regardless of miles driven |
| Maintenance reserve | Preventive service, parts, labor, and wear items set aside per operating hour | Variable, but predictable when tracked by hour |
Crew staffing usually carries the total, because a crewed apparatus pays labor for every hour it stands by, not only for the hours it responds. Idle fuel is the pool most often underestimated: pump tests, long scene times and station idling burn fuel without adding a road mile. Maintenance reserve turns wear into an hourly allowance, which lets a fleet manager budget for reliability instead of reacting to it. Seating capacity, settled when a department chooses fire fighting truck platforms, fixes how much staffing cost the vehicle will carry for its whole service life.
Capital cost sits outside the figure. Acquisition is a sunk investment, recovered over the apparatus service life and handled through total cost of ownership analysis and replacement planning; it does not change with the number of hours the truck is available. Ready-hour cost prices availability, not the asset. Some departments do add depreciation for a full lifecycle view, and that is workable, but the line should be labeled and kept separate, because a figure with capital inside cannot be compared with one without.
What follows is the arithmetic. Each pool is assembled in turn, a six-step method applies it to your own fleet, and the result is translated into the line items finance and procurement staff actually review.
Component One: Crew Staffing Cost
In a career department, crew staffing is almost always the largest piece of fire truck cost per ready hour, and the reason is definitional rather than accounting-driven. An apparatus is ready only when a qualified crew is assigned and able to respond. A pumper with no driver and no officer is a capital asset waiting for people. Fuel and tires arrive as bills; staffing arrives as hours, and the hours run all year.
Start with positions, not vehicles. Count the seats that must be filled for the apparatus to be deployable, multiply by shift hours per position to get human hours, then load the result: wages, benefits and pension contributions; overtime backfill for leave, vacation and sick time; training and certification upkeep such as driver-operator and pump testing; and a supervisory allocation for battalion chiefs, training officers and administrative oversight. A four-position engine company on a 24/72 schedule works out to about 2,190 hours per position, or roughly 8,760 crew hours a year before any overtime. In formula terms, crew staffing cost equals assigned positions × annual shift hours per position × loaded hourly rate. Divide by the hours the unit was actually staffed and in service and you have the staffing portion of fire truck cost per ready hour.
The same logic produces very different numbers across staffing models, which is why benchmarking needs care. Career departments carry the full loaded wage and benefit burden inside the apparatus metric, and their figure reflects sustained 24-hour coverage. Volunteer departments hold most personnel cost outside the apparatus budget, so their fire apparatus operating cost looks low per ready hour even though the underlying labor is real and simply recorded elsewhere. Paid-on-call and combination departments sit between the two: stipends, drill pay and callback wages are tracked, but the denominator moves with actual staffing reliability, which can push the figure above a career unit’s because ready hours are fewer and less predictable.
Two policy levers move this component directly. Minimum staffing standards fix the position count, so taking a company from three to four members multiplies the loaded rate across every shift hour of the year. Response-time targets fix how many hours must be staffed: closing turnout or coverage gaps means more concurrent staffed hours, more backfill and more supervisory depth. Both raise crew staffing cost by design, and both are cheaper to model before adoption than to discover afterward. Departments planning fleet expansion can review heavy duty fire truck configurations to match seating and pump capacity to the staffing level the budget can sustain.
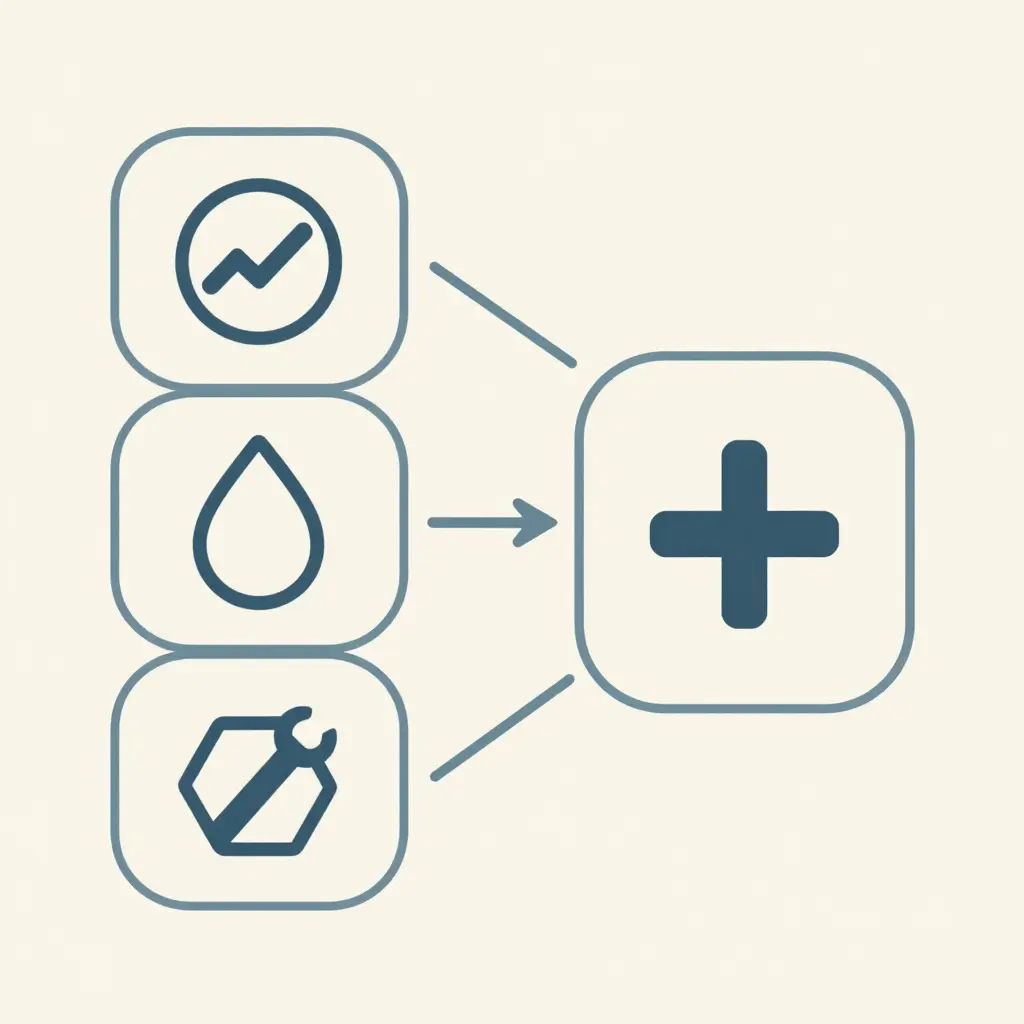
The diagram below shows the structure: three pools feeding one blended number, so no component hides inside the total. Larger platforms, the kind covered under heavy-duty fire truck platforms, simply widen the staffing pool at the base.
Component Two: Idle Fuel Burn
Fuel cost per ready hour is driven mostly by hours the apparatus spends running without turning a wheel. Pump testing, scene standby, station warm-up, aerial or monitor operation and long on-scene time all consume fuel without adding road miles. Mileage is the smaller variable: a first-out pumper may log 4,000 to 6,000 road miles a year while piling up 300 to 500 hours at idle or elevated idle.
Separating idle consumption from road consumption is what puts fire apparatus fuel cost in the line where it accrues. Fleets that track only miles and gallons purchased tend to charge most fuel to responses, which makes idle-reduction measures look ineffective on paper even when they are working.
Sizing idle burn by apparatus class
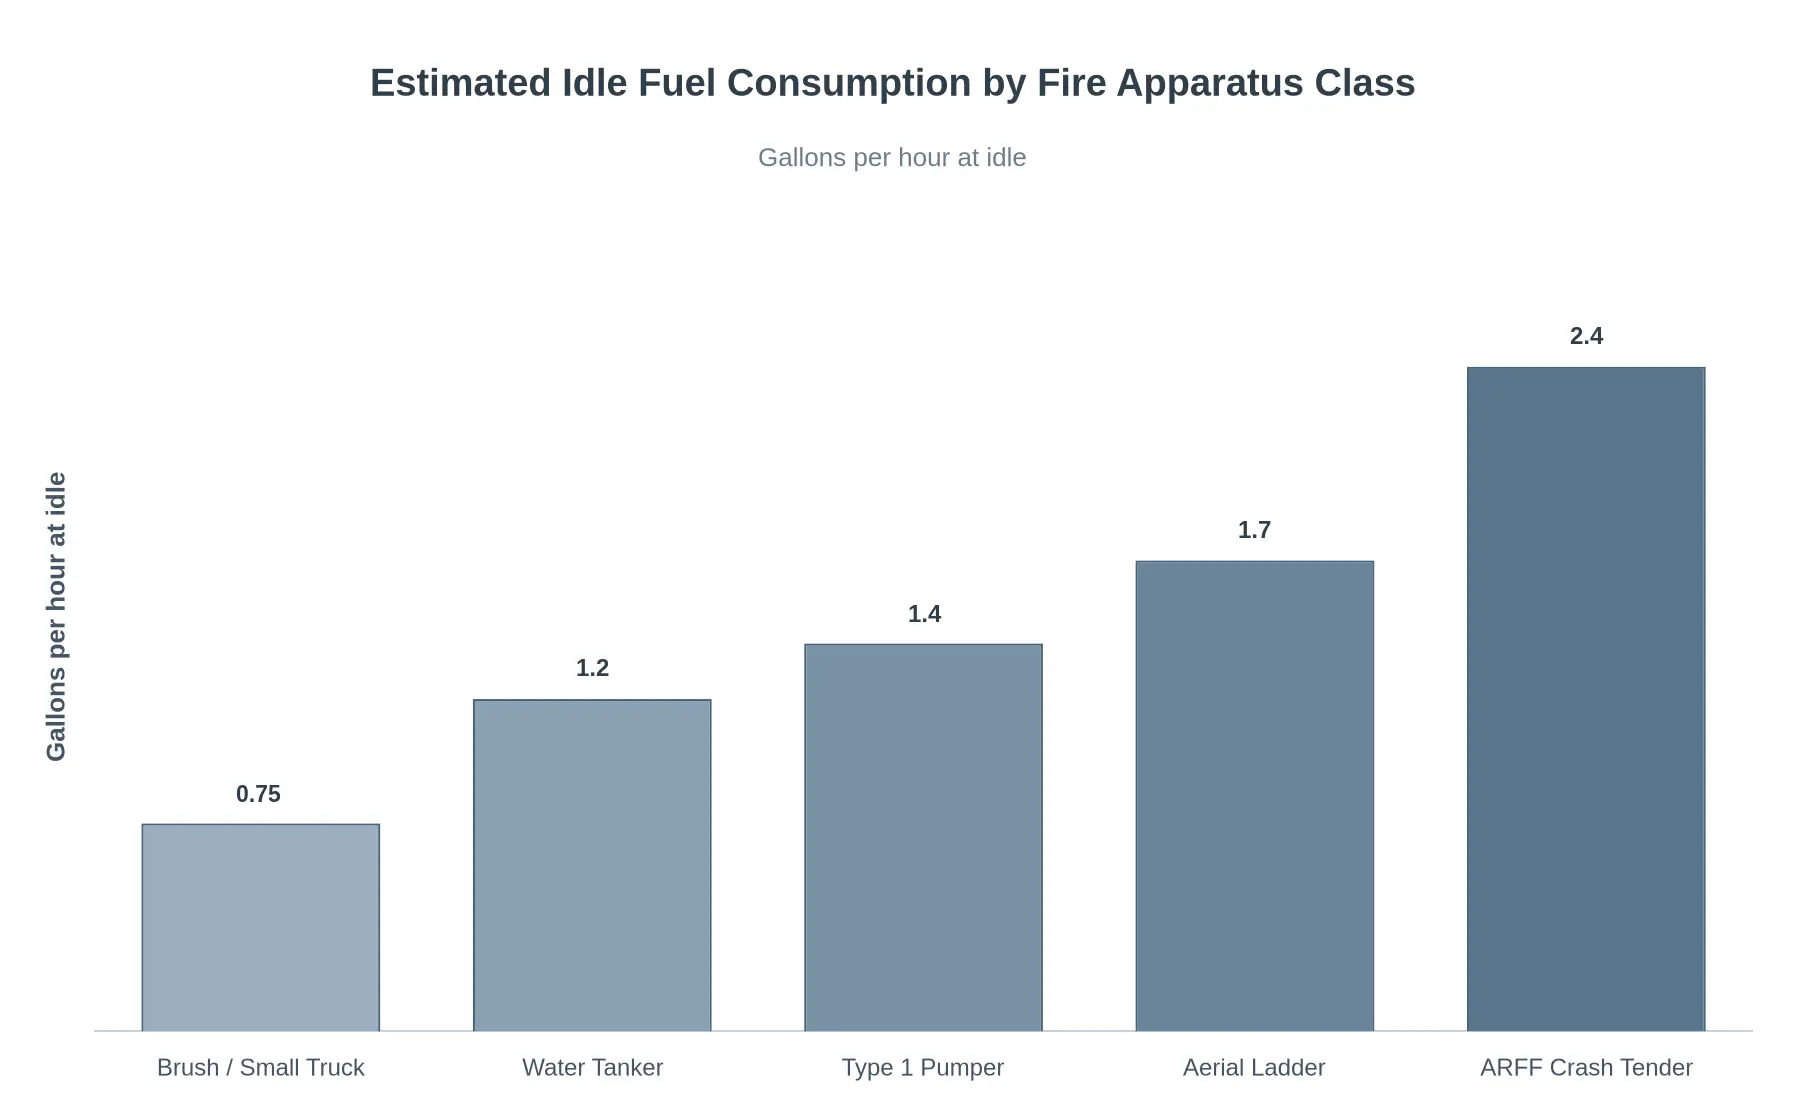
Begin with a defensible burn rate at idle for each class. Published engine data works, and so does a short fuel-flow measurement taken during a pump test. What matters is that the figure belongs to the class; a fleet-wide average will misstate every apparatus in it.
Building the calculation
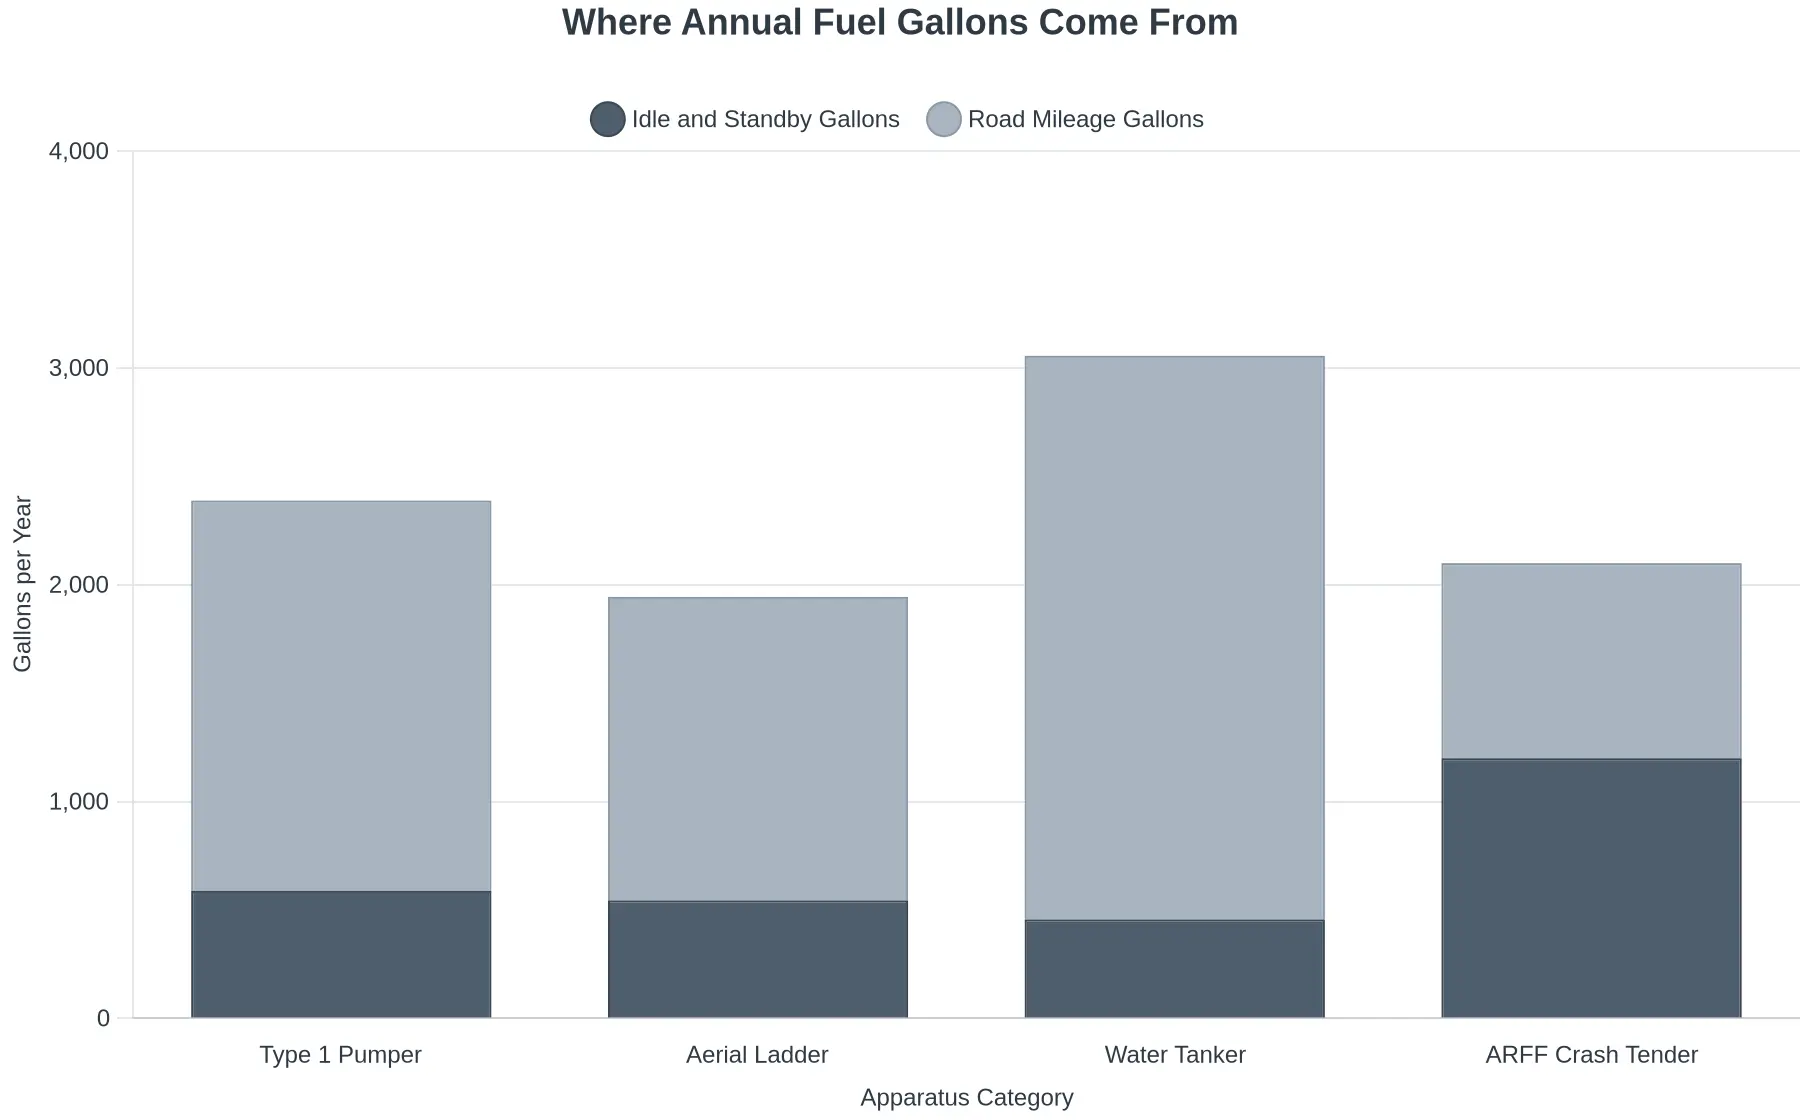
Three steps: multiply idle fuel consumption per hour by annual idle and standby hours, add road-mileage consumption, divide the total by ready hours. The table applies that arithmetic to representative annual duty cycles.
| Apparatus class | Idle burn (gal/h) | Idle/standby hours/yr | Idle gallons/yr | Road gallons/yr | Total gallons/yr | Ready hours/yr | Fuel gal/ready hour | Fuel cost/ready hour at $3.60/gal |
|---|---|---|---|---|---|---|---|---|
| Brush / small truck | 0.75 | 300 | 225 | 1,100 | 1,325 | 2,000 | 0.66 | $2.39 |
| Water tanker | 1.2 | 380 | 456 | 2,600 | 3,056 | 3,200 | 0.96 | $3.44 |
| Type 1 pumper | 1.4 | 420 | 588 | 1,800 | 2,388 | 3,500 | 0.68 | $2.46 |
| Aerial ladder | 1.7 | 320 | 544 | 1,400 | 1,944 | 2,600 | 0.75 | $2.69 |
| ARFF crash tender | 2.4 | 500 | 1,200 | 900 | 2,100 | 1,800 | 1.17 | $4.20 |
The classes diverge in ways worth noticing. A water tanker burns more total fuel than an aerial because of mileage, while an ARFF unit burns less total fuel and still carries the highest fuel cost per ready hour, thanks to long standby periods at high idle.
Variables that shift the figure
Engine and emissions-control strategy. Modern diesels often run elevated idle around 900 to 1,100 rpm for exhaust thermal management, which can raise burn rates 15 to 30 percent above curb idle. Two otherwise identical pumpers from different model years may therefore post materially different idle numbers.
Auxiliary power. A diesel-fired APU or battery-based climate system typically draws 0.1 to 0.3 gallons per hour and displaces most station warm-up and scene lighting load. Each hour moved off the main engine removes roughly one to one and a quarter gallons.
Pump-drive loads. Pumping in gear adds engine load well beyond idle, particularly at draft or high discharge pressure. Chassis selection matters here: a heavy-duty fire truck rated for sustained pump duty will hold a more stable fuel curve than a lighter commercial chassis pushed to the same task.
Fuel price. Every $0.50 per gallon move changes the fuel component by roughly $0.35 per ready hour for a mid-size pumper. The dollar effect is small enough that price swings rarely justify changing apparatus strategy, but they do affect the accuracy of multi-year forecasts.
Duty cycle and aftertreatment. Short, repeated runs prevent passive regeneration, load the particulate filter with soot and trigger active regeneration cycles that burn additional fuel. High idle cuts both ways: it supports thermal management and raises hourly consumption, so the net effect has to be measured rather than assumed.
Smallest pool, most controllable lever
For most departments the fuel component lands between $2 and $5 per ready hour, well below crew staffing and comparable to or below a funded maintenance reserve. That modest size is exactly why idle burn goes unmanaged, and why it is the easiest pool to move. Idle-reduction policy, APU specification, automatic shutdown timers and engine-hour telemetry all act on the numerator without touching service levels. The prerequisite is a documented baseline; without one, a chief or fleet manager cannot show a change in the fuel line that is larger than rounding.
Component Three: Maintenance Reserve
A maintenance reserve is a planned accrual per ready hour, money set aside in advance for work every apparatus will eventually need: preventive service, wear items, pump and aerial certification testing, diagnostics, unscheduled repair. The reason for it is timing rather than accounting preference. Those costs arrive whether or not the budget anticipates them, and accruing them spreads the burden across the year instead of landing it as an annual shock.
Build the reserve from history. Take actual annual maintenance and repair spend for the apparatus, add the scheduled service its class requires (engine service, brake and tire cycles, pump tests, aerial inspections), divide by annual ready hours, then add a contingency scaled to age and duty cycle to cover the gap between planned work and what actually fails.
The contingency is where aging fleets get expensive. Older apparatus fails more often, each failure costs more, and tightening parts availability pushes prices up and stretches lead times, so the reserve rate climbs faster than mileage or engine hours alone would suggest. Watching wear-item and component pricing keeps that escalation visible, which is why buyers increasingly check fire truck parts availability alongside service schedules. Accuracy improves again when work-order costs are coded by apparatus rather than by shop, because only then does fire apparatus maintenance cost map cleanly onto ready hours. Departments that code to the vehicle can defend the fleet maintenance budget with work orders instead of assumptions.
How the Five Cost Lines Weigh Against Each Other
So far the pools have been treated separately. In a real budget they appear together, and the shares below show how they usually fall. Consumables get a line of their own because tires, lubricants, foam concentrate and DEF behave differently from both fuel and reserve.
| Cost Component | Primary Cost Drivers | Calculation Basis | Data Source Typically Available | Indicative Share of Total |
|---|---|---|---|---|
| Career Crew Staffing | Shift minimums, rank and step pay, overtime, benefits and pension loading | Numerator: base wages + benefits + overtime + pension contribution. Denominator: annual ready hours, out-of-service time excluded | Payroll and personnel records, shift rosters, collective bargaining schedules | 78-92% |
| Volunteer / Paid-on-Call Staffing | Hourly or per-call stipends, LOSAP and retirement contributions, paid training and recertification hours | Numerator: stipends + per-call pay + retirement contributions + paid drill hours. Denominator: annual ready hours | Stipend ledger or payroll, call and drill logs, LOSAP statements | 5-35% |
| Fuel: Idle, Standby and Road | Engine idle and PTO/pump hours, gallons per hour at high idle, miles driven, delivered diesel price | Numerator: idle hours x gallons per hour + road gallons, x fuel price. Denominator: annual ready hours | Telematics or ECM idle-hour reports, fuel-card and bulk-fuel invoices | 1-4% |
| Maintenance Reserve | Apparatus age and mileage, PM and pump-test intervals, parts and labor inflation, reserve funding level | Numerator: preventive maintenance + unscheduled repairs + annual reserve set-aside. Denominator: annual ready hours | Work-order or shop management system, warranty claims, capital reserve schedule | 6-15% |
| Consumables and Fluids (tires, lubricants, foam concentrate, DEF) | Tire life and road conditions, oil and coolant use, foam test and discharge volumes, DEF consumption tied to engine hours | Numerator: tires + lubricants + foam + DEF + shop supplies. Denominator: annual ready hours | Parts inventory issues, tire records, foam test and discharge logs, bulk fluid purchases | 1-3% |
Treat each share as a range, not a fixed figure, and read the two staffing lines as alternatives rather than additions: a career department carries the first, a volunteer or combination department carries the second, and the remaining lines divide up what is left. The ranges also do not add to 100 on their own, which is a reminder that the split moves with staffing model, apparatus class and call volume. The worked example behind the chart is a career-staffed structural apparatus at roughly 85 percent crew staffing, 10 percent maintenance reserve, 2 percent fuel and 3 percent consumables. Compare shares only within the same staffing model, apparatus class and call volume band. A department running a heavy-duty fire truck on low call volume will show a higher crew share, because fixed staffing cost is spread over fewer ready hours.
Reading the Split
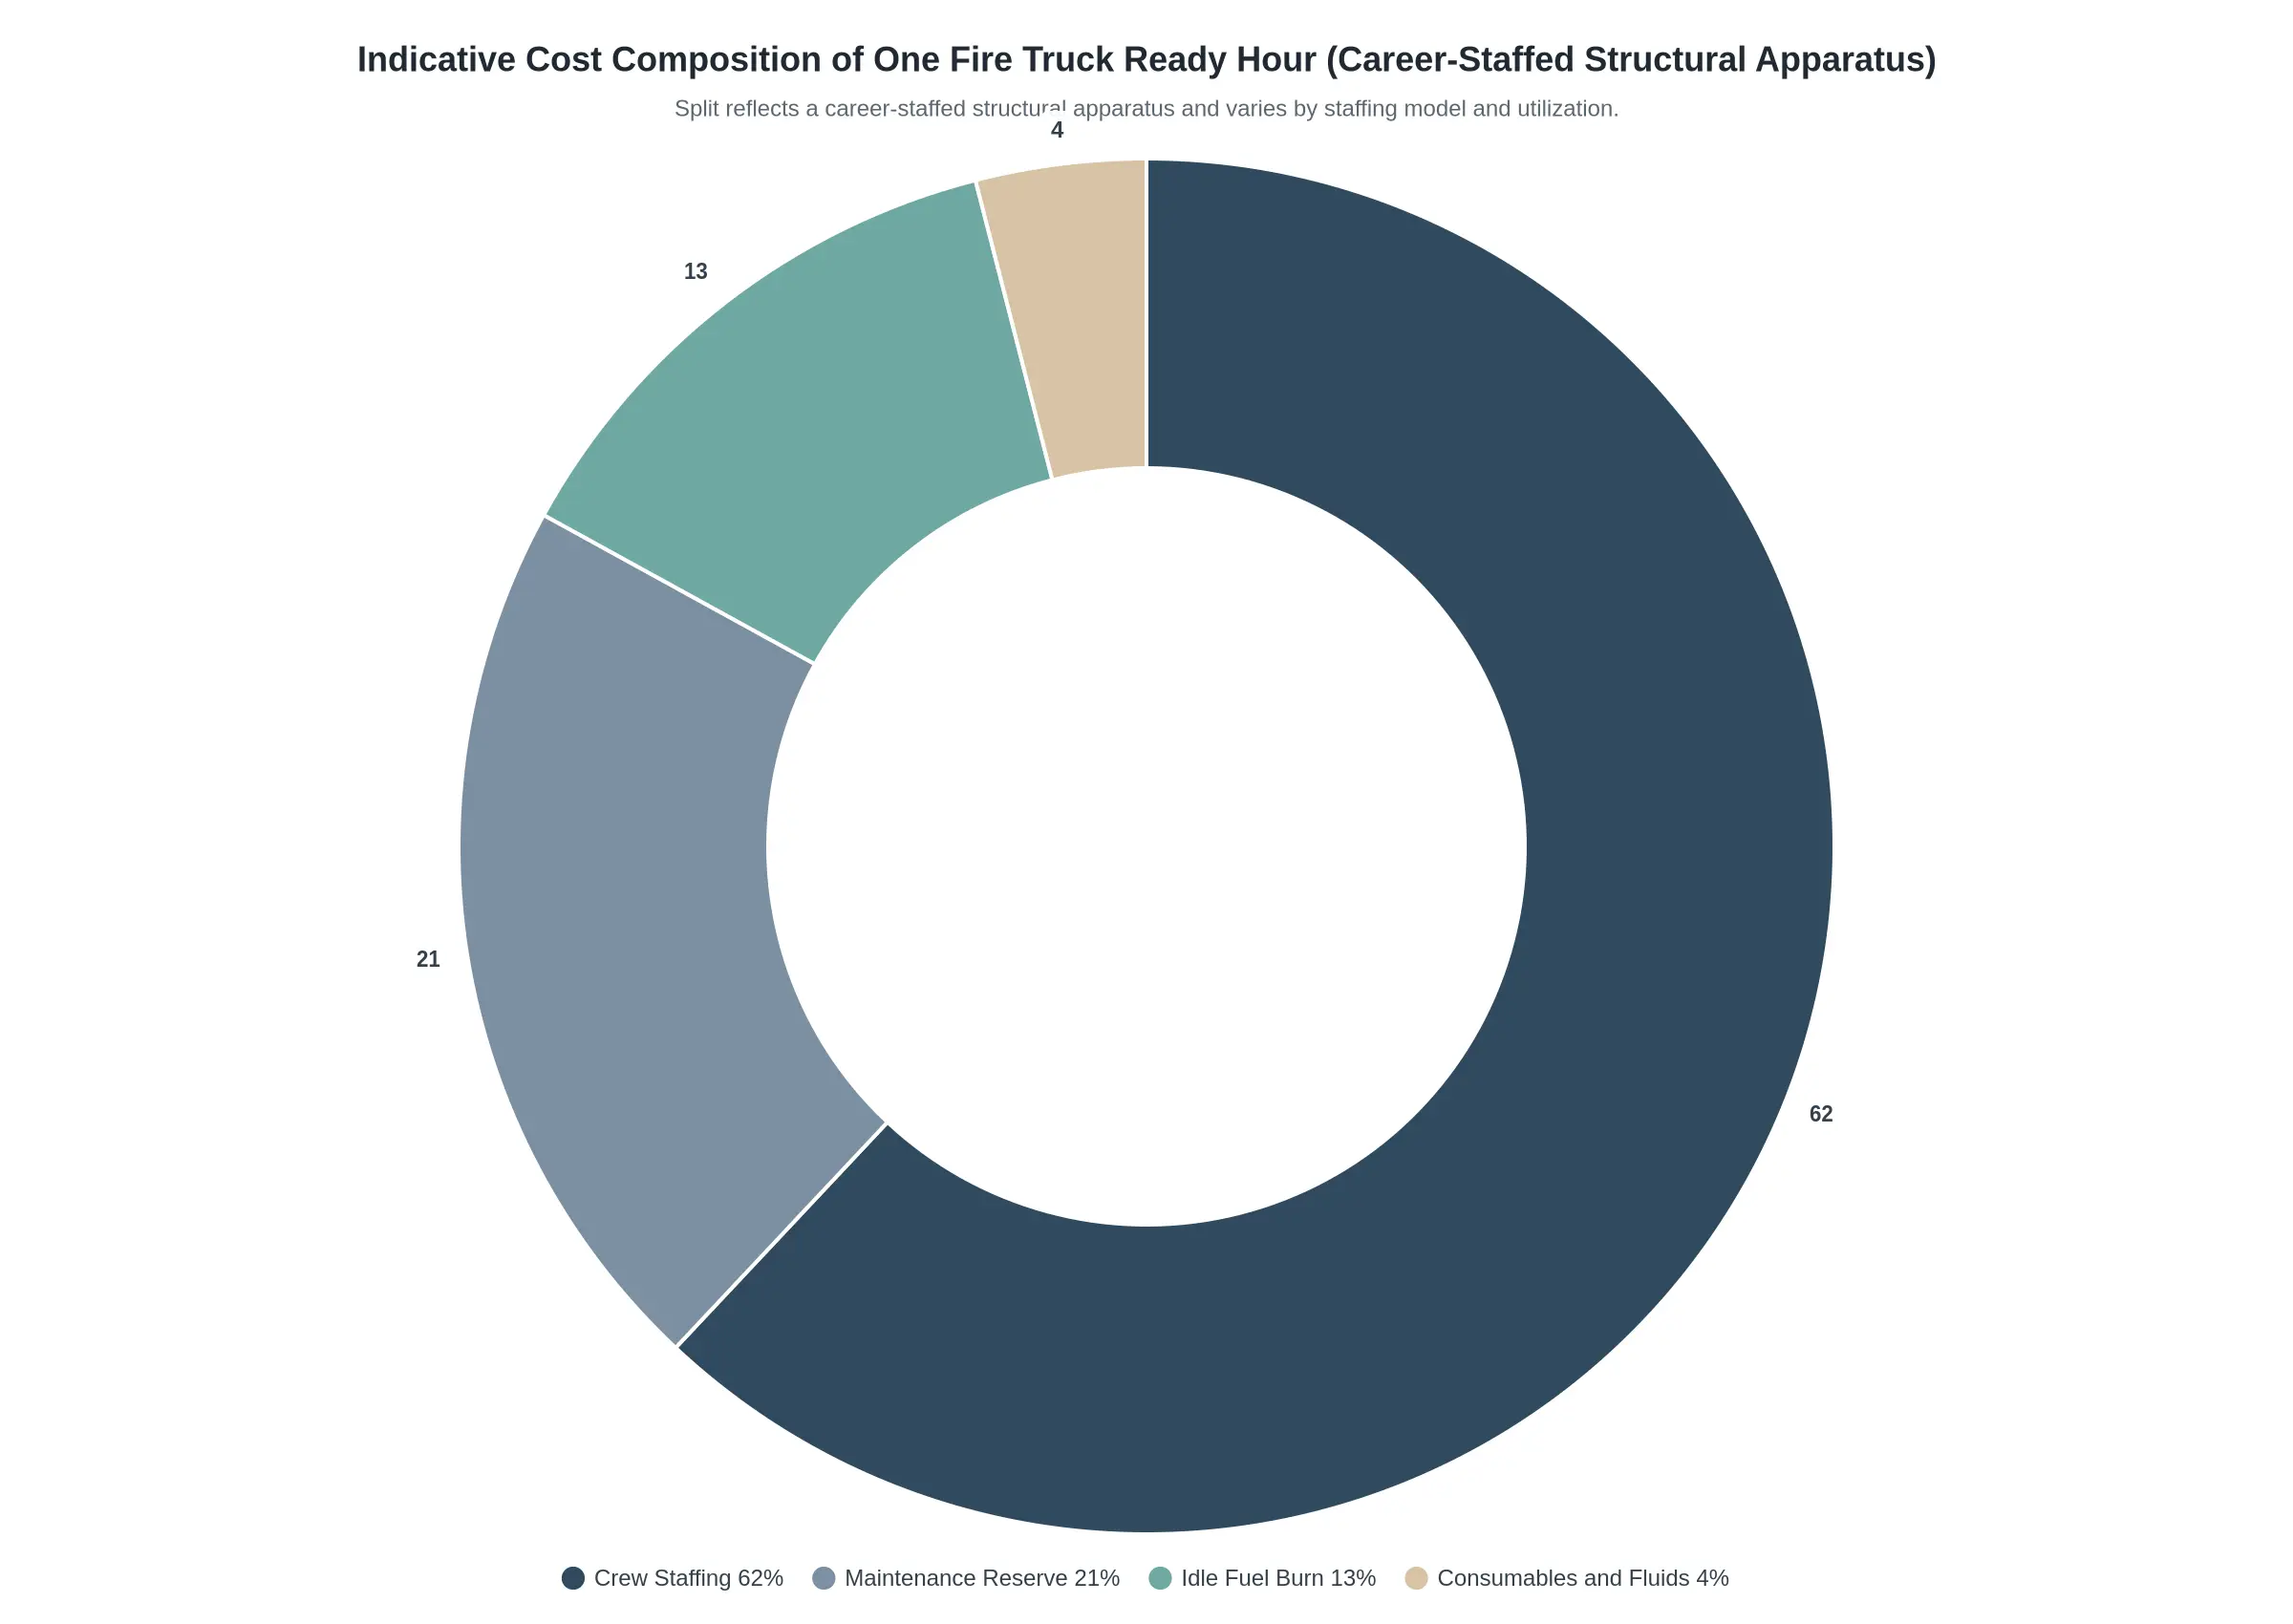
Set against the dollar figures in the earlier sections, the chart says something plain: readiness is mostly a labor product. More than four-fifths of every ready hour is the standing cost of trained people seated, equipped and available. The truck is a smaller line item than most budget narratives suggest.
| Cost Pool | Share of Ready Hour | What Drives It |
|---|---|---|
| Crew Staffing | 85% | Shift strength, rank mix, benefits load, overtime |
| Maintenance Reserve | 10% | Apparatus age, call volume, PM compliance |
| Idle Fuel Burn | 2% | Idle hours, engine size, auxiliary load |
| Consumables and Fluids | 3% | Filters, lubricants, DEF, small wear parts |
Why the Small Slices Still Matter
Two percent of a ready hour sounds negligible until it is multiplied across a fleet and a fiscal year. Idle-hour reduction policies, automatic idle-shutdown programming and shore power at the station all chip away at that slice without touching staffing. The consumables line behaves the same way: minor per truck, revealing in aggregate, and sensitive to how disciplined the preventive maintenance schedule is. Departments that log consumable usage carefully tend to catch component wear before it becomes a roadside failure, and they usually find that sourcing quality replacement fire truck parts on a planned cycle costs far less than emergency procurement after a breakdown.
Adjusting the Model to Your Department
Treat these proportions as a starting reference, not a universal standard. A volunteer or combination department will show a very different staffing slice, and a frontline pumper running high call volume will carry a heavier maintenance reserve than a reserve rig. To localize the numbers, substitute your own fully loaded hourly labor rate, your fleet’s actual idle hours and your three-year maintenance history, then recompute. Whichever pool moves most when you do that is the one worth working on first.
Planning note: The split above reflects a career-staffed structural apparatus. Staffing model, call volume, apparatus age and climate all shift the proportions, so rebuild the calculation with your own operating data before presenting it to a budget committee.
From Composition to Decision
Once the composition is visible, the conversation with finance changes character. Instead of arguing over whether a truck is expensive, you can point to the pool driving the number and show what a realistic intervention would recover. That position survives scrutiny far better than a fleet-wide percentage cut.
How to Calculate Cost per Ready Hour: Six Steps
The calculation produces a single number, fire truck cost per ready hour, that puts every rig in the fleet on the same measuring basis.
Define ready hours. Start with total available apparatus hours for the year and subtract every hour the rig sat out of service, was committed to training that took it off the line, or was held for maintenance downtime. The remainder is the denominator for the entire model, so write the subtraction rules down once and apply them identically every period.
Total the loaded crew cost. Multiply each assigned riding position by the fully loaded hourly cost of the people who fill it: base wage, benefits, overtime, pension contribution and paid training time. Charge that cost to the apparatus rather than the station, so the figure reflects what it costs to put this specific rig on the road.
Split annual fuel cost. Pull total fuel spend from the fuel management system and divide it into idle hours and road mileage. Charge idle burn at the engine manufacturer’s published idle consumption rate, and derive road fuel from miles driven against measured gallons per mile.
Set the maintenance reserve accrual. Accrue a fixed amount per ready hour, built up from dollars per mile and per engine hour, toward major component life, pump overhauls and eventual replacement. The accrual is a budgeting figure rather than a receipt; it converts future capital work into a cost of ownership line that appears every year instead of arriving as a shock.
Add consumables and fluids. Pull oil, filters, coolant, tires, brake work and small hardware from work-order records for the same twelve-month window. Ordering standard fire truck parts on a scheduled basis keeps this line small and predictable rather than lumpy.
Divide and document. Sum steps two through five, divide by the ready hours from step one, and record the assumptions beside the answer: period covered, idle rate applied, reserve methodology, treatment of training hours. Without that note the number will not survive a budget hearing.
Run the resulting figure across apparatus of different age and class, then repeat it each year. The trend line, not any single year’s calculation, is what should drive fleet budget planning.
Cost per Ready Hour by Apparatus Class
The chart below puts every apparatus class on the same footing: indicative cost per ready hour, in USD. Read it as a directional planning benchmark, not an audited figure. The spread comes overwhelmingly from crew complement and staffing model, meaning how many seats must be filled and whether those seats are career, part-time or volunteer, rather than from what the chassis cost on delivery day. A $700,000 pumper and a $1.2 million aerial can land far apart or surprisingly close on this metric depending on who rides them and how often they roll.
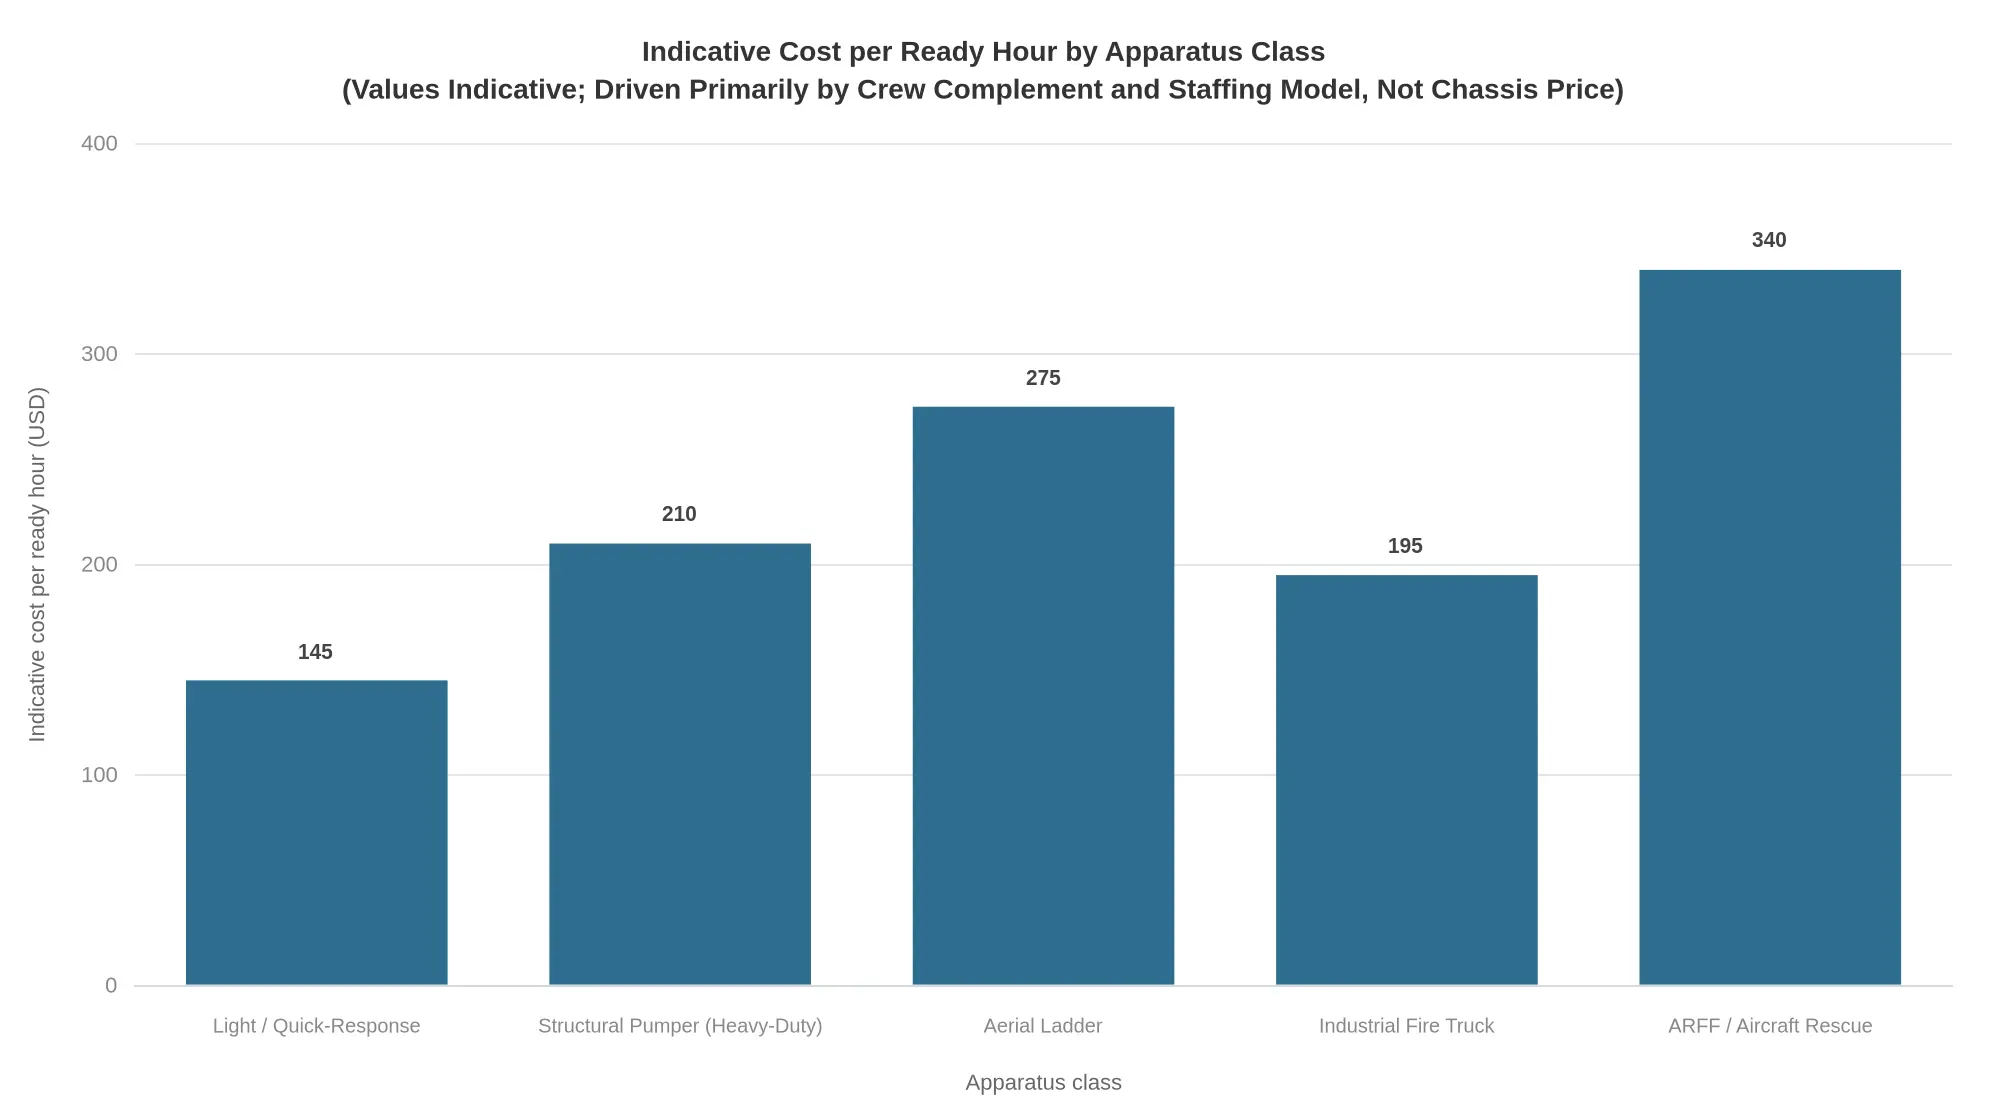
A few patterns are worth carrying into the budget conversation. Light and quick-response units stay lowest because they usually run two-person crews and lean on part-time or volunteer staffing; a per-ready-hour metric does not fall just because call volume is high. Industrial units come in below heavy-duty structural pumpers for much the same reason: leaner crews, not cheaper iron. Aerial ladders and ARFF rigs anchor the top of the range because both need larger, more specialized crews, and ARFF carries mandatory response-time readiness that keeps apparatus staffed and fueled through long quiet stretches. When a class looks expensive per ready hour, read the staffing line first; that is almost always where the number is made.
Translating Ready-Hour Cost into Fleet Budget Decisions
Officials approve a purchase price once and then live with the operating cost for the rest of the apparatus service life. Cost per ready hour shifts the conversation accordingly: not which truck is cheapest to acquire, but which configuration delivers the most available, staffed response capacity per dollar committed each year.
Availability and Crew Cost Replace Sticker Price
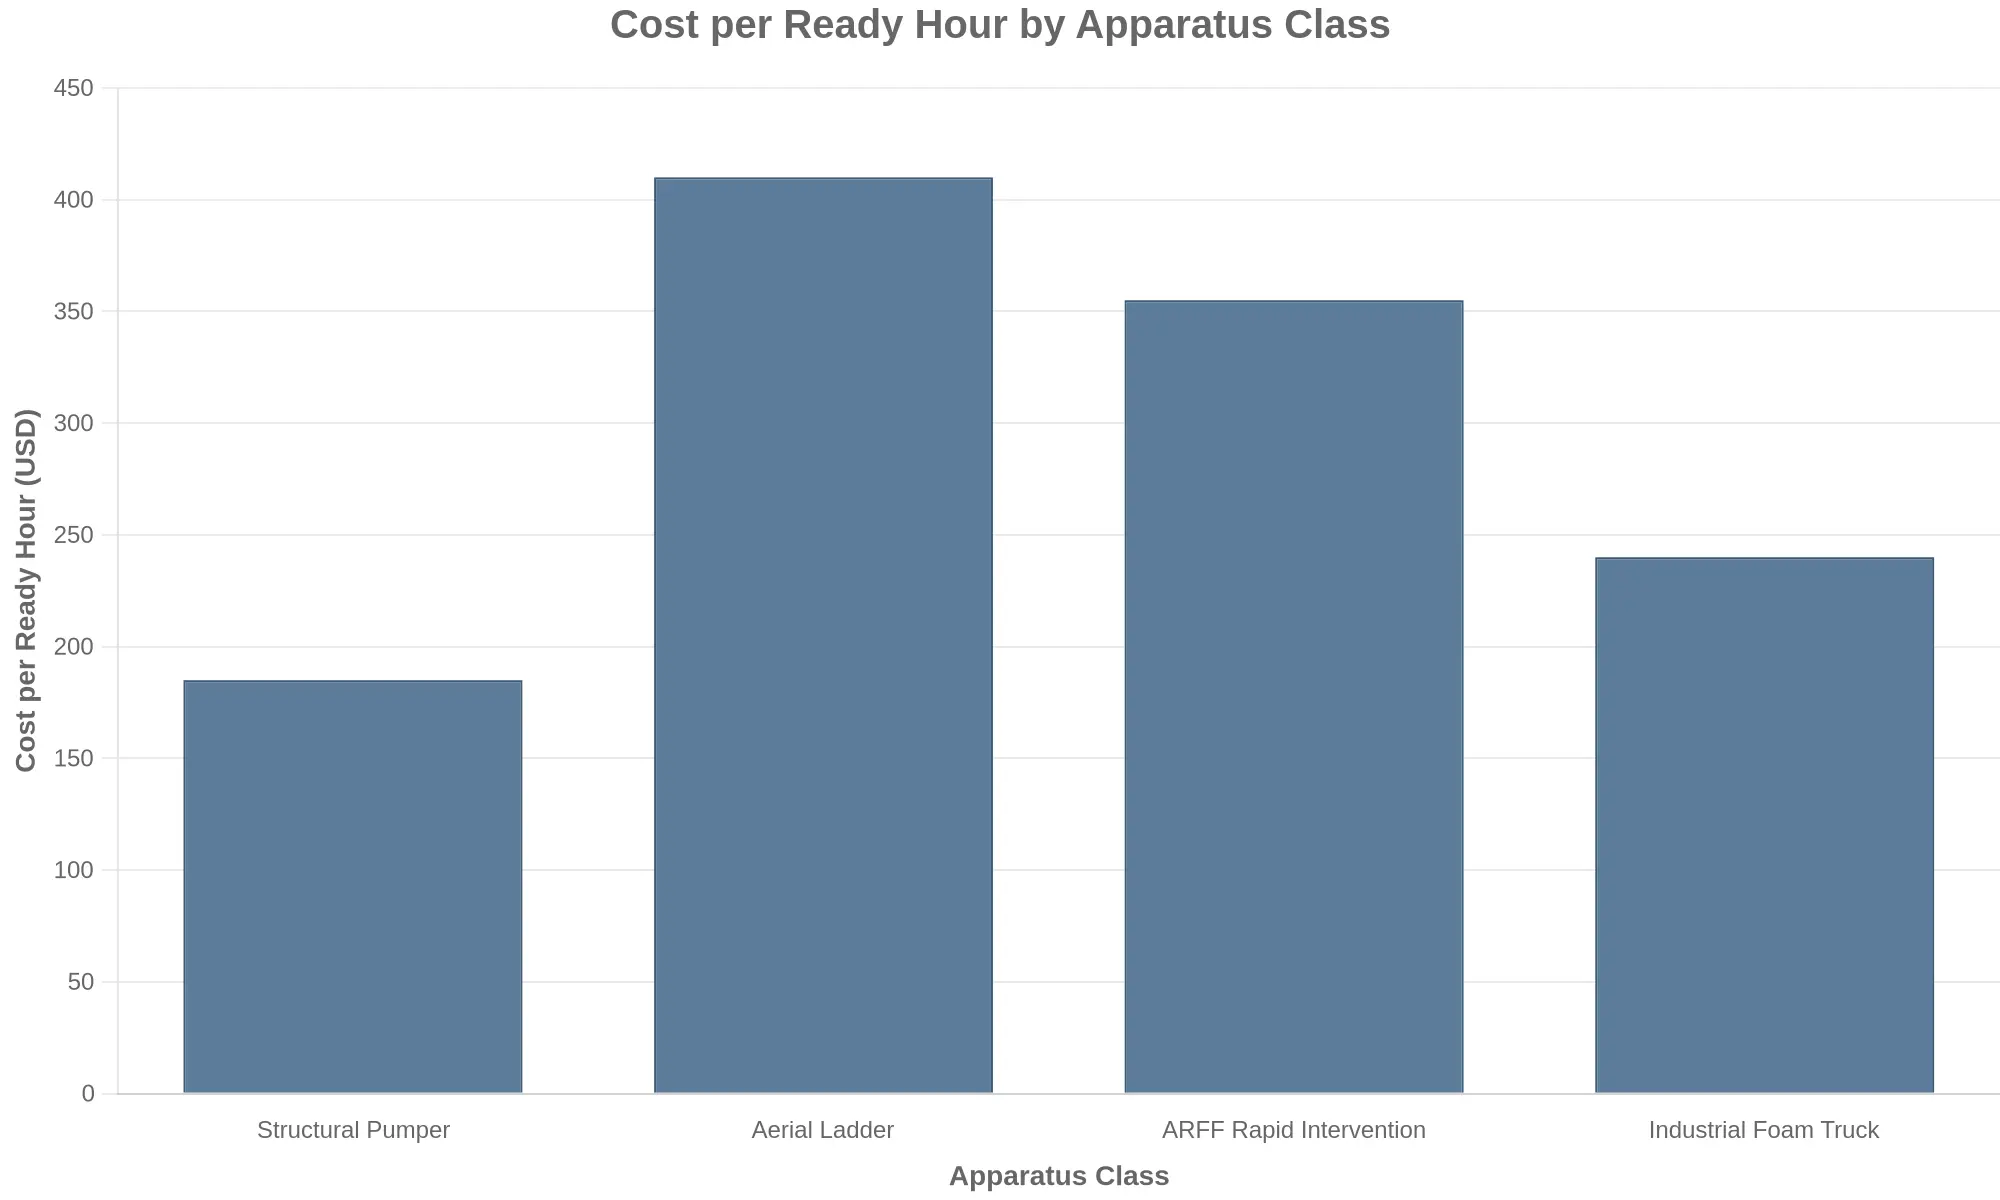
Two apparatus with similar purchase prices can carry very different staffing burdens. A pumper needing four seats and an aerial needing a larger crew create different annual labor commitments before either turns a wheel. Expressed per ready hour, fire apparatus total cost of ownership shifts the comparison toward availability: hours staffed, hours available, hours actually dispatched.
A comparison built this way tends to favor apparatus sized to the district’s call profile rather than to a specification checklist. It also makes class differences explicit, which matters when a standard structural unit is being weighed against heavier-duty apparatus built for sustained high-call service.
Underutilized Apparatus Becomes Visible
A unit holding a full crew assignment but a small share of annual dispatches carries the highest fixed staffing cost per ready hour in the fleet. The metric does not label that unit a procurement mistake. It identifies a deployment question, and the answers are operational: re-stationing, cross-staffing, reserve reassignment, or a smaller chassis built for lighter call volume.
Keep-Versus-Replace When Reserve Rates Rise
As apparatus age, maintenance reserve rates climb. Parts availability tightens, corrosion repair recurs, and pump or aerial rebuild intervals shorten. Folding that rising reserve into the ready-hour figure shows the year the cost curve crosses the economics of replacement, instead of leaving the decision to a condition rating or an arbitrary mileage threshold.
Applying the Model Across a Mixed Fleet
The method works best when each apparatus class is matched to the call profile it actually serves, so staffing and reserve costs track real response demand.
| Apparatus class | Typical call profile | Budget question it answers |
|---|---|---|
| Structural pumper | Frequent structural and EMS-support alarms | Can one four-seat crew absorb peak volume without a second unit? |
| Aerial ladder | Concentrated vertical-reach demand | Is reach needed often enough to justify its staffing premium? |
| ARFF | Airfield standby plus mutual aid | What does standby availability cost per hour, separate from incident use? |
| Industrial foam | Fixed-site hazard coverage | Does on-site risk justify a dedicated crew? |
Aerial apparatus and aircraft rescue and firefighting vehicles carry high fixed readiness costs, so their ready hours need to be justified by call frequency and mutual-aid obligations. Industrial fire trucks and dedicated foam units often support a single facility, where the cost comparison belongs in the plant’s own risk budget. Where a class can be served by a lighter or commercial chassis, replacing a heavy unit changes the fixed staffing denominator as much as the capital line.
CIMC Tianda supplies firefighting and rescue equipment across multiple apparatus categories, including pumpers, aerials, ARFF vehicles, industrial units and fire truck parts, which lets a fleet compare classes on a consistent specification basis.
Presenting the Figure to Budget and Procurement Officials
Councils vote on lump sums, then inherit the recurring cost. Present the ready-hour figure as a per-unit-of-service cost alongside the capital request: cost per available hour, cost per dispatched call, and the crew component separated from fuel and maintenance reserve. That structure lets a council see a $700,000 pumper as a stream of staffed hours rather than a single line item, and it gives procurement staff a defensible basis for comparing bids that bundle different staffing, warranty and parts support terms.
The result is fleet budget planning built on capacity delivered, not on vehicles owned.
From Ready-Hour Cost to Budget Line: The Translation Logic at a Glance
Before defending a number in front of a council or a procurement committee, it helps to see how the math moves. The diagram below traces the five-step translation from raw operating data to a budget line: capture cost data, aggregate components, normalize by ready hours, compare results across apparatus classes, allocate budget. Each stage depends on the one before it, which is why a weak input at step one quietly distorts the request at step five.
Read it left to right. If your current model skips a step, usually normalization or cross-class comparison, that gap is where an aggressive cost-per-ready-hour figure tends to get challenged. Departments that want line-item transparency across pumpers, aerials and specialty units can explore our fire fighting truck categories to align class definitions before the comparison step.

Figure: The five-stage translation sequence used throughout this analysis – cost capture, aggregation, ready-hour normalization, cross-class comparison, budget allocation.
Treat each node as an audit checkpoint. If a reviewer questions the fleet budget line, walk them backward node by node and show which inputs, hours and reserve assumptions produced the figure. That is a stronger answer than defending a single blended average.
Frequently Asked Questions
Does cost per ready hour include apparatus depreciation?
Not in the version defined here, which divides recurring operating cost by ready hours. Depreciation is a capital cost, and mixing it into the availability figure makes the result incomparable with departments that leave it out. Departments that want a full lifecycle number can add depreciation as its own line, on a straight-line basis over expected service life or as a replacement-cost sinking fund, and should publish both figures so reviewers know which one they are reading. What should never happen is a comparison between a numerator with capital inside and one without; that difference alone can reverse the ranking of two apparatus.
Why is crew staffing usually the largest component?
Labor typically accounts for 75 to 90 percent of fire truck cost per ready hour in a career department, because crews are paid for coverage rather than for incidents. A staffed apparatus accrues wages and benefits across every hour it stands ready, while fuel and maintenance accrue mainly when the truck moves or pumps. The ratio holds at low call volume too, since standby time dominates the denominator. Benefit loadings, overtime and mandated training hours widen the gap further.
How should idle fuel consumption be measured for an existing apparatus?
Pull accumulated idle hours and total fuel burned from the engine ECM, then divide gallons by idle hours to establish a baseline rate. Validate that figure with a controlled test: run the engine at high idle with typical PTO and pump loads for a fixed interval and measure tank draw. Most apparatus idle at roughly 0.8 to 1.5 gallons per hour depending on displacement and accessories. Multiplying the validated rate by annual ECM idle hours gives idle fuel consumption in gallons and a defensible cost line.
What maintenance reserve rate is reasonable for an aging fleet?
Set the maintenance reserve as an annual percentage of apparatus replacement value: about 2 to 3 percent for units under five years, 4 to 6 percent through mid-life, and 6 to 9 percent past year 15, when pump overhauls, chassis corrosion repair and electrical faults cluster. Build the rate from actual work-order history where it exists, and hold the funds in a restricted account so deferrals register as a budget gap rather than disappearing. Sourcing components early through a stable fire truck parts inventory reduces the cost of unplanned downtime.
Can cost per ready hour be compared across departments?
Only when both numerator and denominator are defined identically. Two departments can report different numbers for the same rig if one excludes depreciation, omits administrative overhead, or counts only incident hours as ready hours. Comparison is valid when both apply the same cost boundaries and define ready hours as staffed, dispatchable time. Publish the assumptions alongside the metric so differences reflect operations rather than accounting choices.
Conclusion
The analytical chain behind fire truck cost per ready hour is straightforward once its components are named. The figure combines crew staffing, fuel, maintenance reserve and consumables, and every one of those inputs can be measured with data most departments already hold: payroll and shift rosters, pump-hour and engine-idle logs, and maintenance work orders from the parts and service side of the fleet. No new systems and no outside consultants are required. The resulting number turns apparatus and staffing decisions into comparable units of service, which gives budget officers and procurement teams a shared language for review.
Read that way, the number answers a different question than the sticker price does. The dominant lever is staffing and availability discipline, not chassis price. A premium rig that sits out of service or runs short-crewed will post a higher cost per ready hour than a modest apparatus kept fully staffed and in rotation. Within the formula, reserve accuracy and idle-fuel discipline are the two most controllable pools, because both respond to policy and daily habit rather than to capital spending.
Tracked on a regular cadence, ready-hour cost turns a one-time purchase price into a lifecycle metric. That steady visibility is what tightens fire apparatus operating cost forecasting and improves budget predictability across the full service life of the apparatus.