Baggage sorter jams look random on the operations floor. They are not. In most airport baggage handling systems (BHS), jams land in the same few windows every day: the hours when arrival waves overlap with departing flight banks and push more bags into the network than steady-state flow can clear.
A baggage handling system (BHS) is the automated network of conveyors, scanners, and controls that moves checked bags from check-in to aircraft. A sorter is the merge-and-divert component that routes each bag to its destination chute or make-up carousel. Buffer capacity is the storage available to hold bags temporarily when downstream lines are saturated, measured in bags or in track length. A peak-hour surge is any interval when inbound bag volume exceeds the sorter’s nominal throughput.
Of those variables, buffer capacity does most of the work. It decides whether a surge drains away as ordinary queuing or becomes a jam cluster that stops the line.
How Sorter Jams Cluster at Peak Hours
A sorter is not a set of independent lines. It is a network of converging merge points, and a jam rarely stays where it starts. When an induction spike puts more bags on the loop than the divert points can pull off, the surplus keeps circulating instead of leaving the system.
A brief slowdown at one divert point — a misaligned tray, a sluggish pusher, a full chute — creates a short queue. Bags behind it spend longer at the merge, so the line backs up. Within seconds the queue reaches the next merge point, and the congestion spreads through the terminal’s shared stand and pier infrastructure.
- Merge points where several feed lines funnel into one track
- Induction spikes that briefly exceed sorter throughput
- Recirculation loops that send delayed bags back into already busy lines
- Downstream blockages — full chutes, stopped takeaway conveyors — that propagate upstream
- Too little buffer capacity to absorb a short demand surge
All of these have the same trigger: arrivals briefly outrun throughput. Without enough buffering, a one-second hiccup becomes a five-minute cluster.
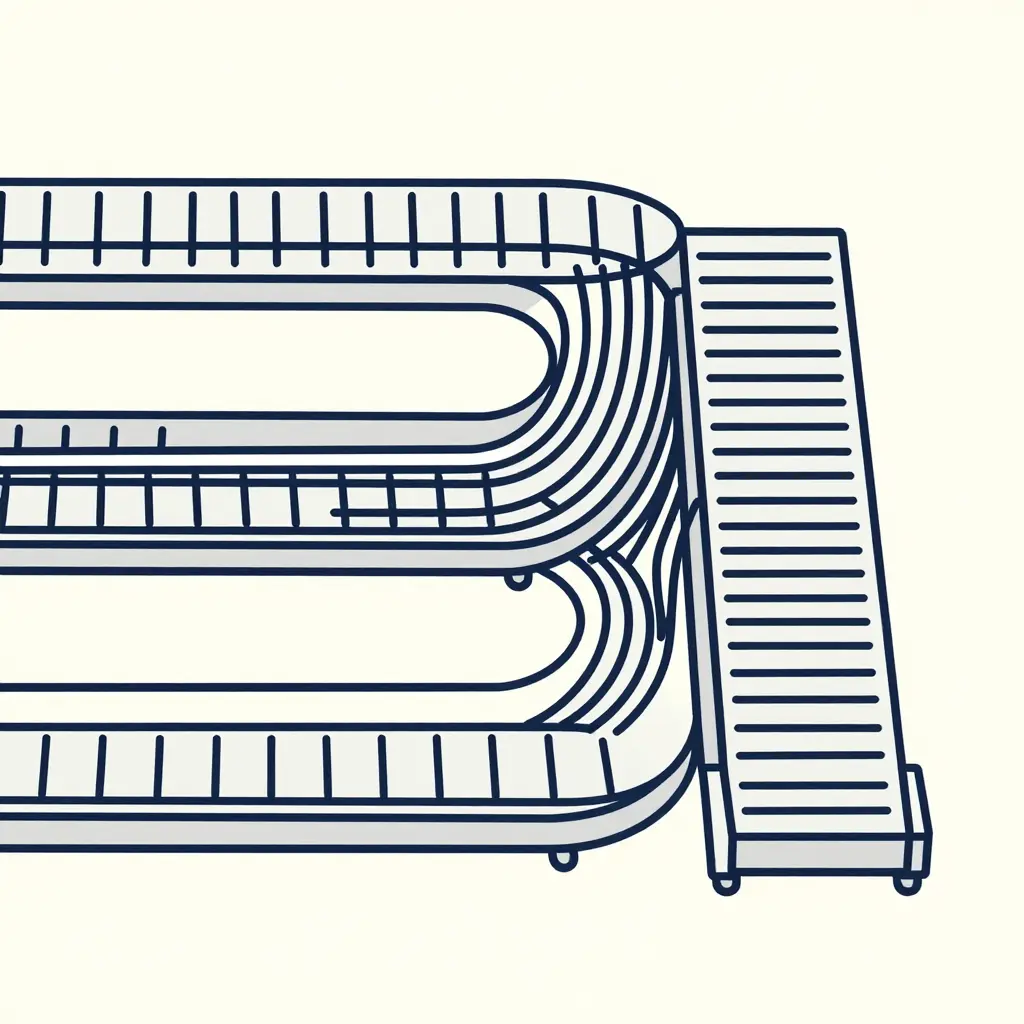
Image-generation brief: Flat minimal 2D schematic illustration showing multiple horizontal baggage conveyor lines on the left converging and merging into a single continuous sorter loop on the right. Flow lines thicken and darken as they approach each merge point, concentrating visual mass at the convergence zones to visually explain why jams cluster where flows converge. Clean geometric line-art, monochrome two-tone palette (off-white background with dark ink-blue/black strokes). No text, no labels, no people, no realistic or photographic detail, no complex assets. Simple vector style with even stroke weight on the loop and heavier strokes at the merge points.
Buffer Capacity Fundamentals
A buffer is a controlled reservoir — usually a multi-lane accumulation conveyor or a recirculation loop — where bags wait between processing stages instead of forcing the sorter to handle them the moment they arrive.
An upstream buffer sits before a merge or sortation point and holds bags until a slot opens. A downstream buffer sits after the sorter and absorbs discharge bursts before makeup induction. Between them, they decouple the fast stages of the system from the slow ones.
That decoupling is what absorbs a peak-hour surge. Extra bags queue in the buffer and the sorter keeps seeing a flow it can actually process. Remove the cushion and a single stoppage backs up into the merge and blocks every feed — which is why jams cluster the way they do.
An undersized buffer fills in seconds, stops the feed, and lets the surge spill upstream as a full halt. An oversized one adds conveyor, motors, controls, and floor space, and it costs more than the problem it solves. Sizing is a balancing act, not a race to the largest number, much like airport ground equipment tolerance and wear. The target is the smallest buffer that still rides out the peak.
Buffer Capacity Sizing Reference by Peak Surge Level
| Peak-Hour Surge Factor | Arrival Rate vs Sorter Throughput | Recommended Buffer Capacity (% of peak flow) | Expected Jam Risk |
|---|---|---|---|
| 1.2-1.5x (Moderate) | 85-95% of throughput | 10-15% | Low |
| 1.5-2.0x (High) | 95-110% of throughput | 20-30% | Moderate |
| 2.0-3.0x (Extreme) | >110% of throughput | 35-50% | High |
| >3.0x (Severe) | >130% of throughput | 50-65% | Very High |
Recommended buffer capacity rises with the peak-hour surge factor: the steeper the arrival surge, the more storage the buffer needs to keep jam risk in check.
Buffer Sizing Methodology: From Arrivals to Accumulation
Sizing starts with two measured inputs: the peak-hour arrival rate (lambda, bags per minute) and the steady-state clearance rate the downstream sorter can sustain. Little’s Law, L = lambda x W, says the average number of items in a system equals the arrival rate multiplied by the time each item spends there. During a surge, W is the surge duration — the measured window in which arrivals exceed throughput.
Quantify the overflow first. If arrivals run at 120 bags/min and the sorter clears 90 bags/min, the excess is 30 bags/min. Over a four-minute surge that is 120 surplus bags.
Next, convert bags into space. At an accumulation density of about 0.4 m per bag on a single-lane conveyor, 120 bags need roughly 48 m of accumulation length.
Then add a safety margin. Designing to absorb 1.5x the calculated peak turns 120 bags into a 180-bag target, or about 72 m of conveyor.
The chain is short: surge duration × arrival surplus gives the bags to store; bags × pitch gives the length; length × margin gives installed capacity. Run it for the worst 15-minute window of the day, never the daily average.
24-Hour Baggage Arrival Rate vs Sorter Throughput
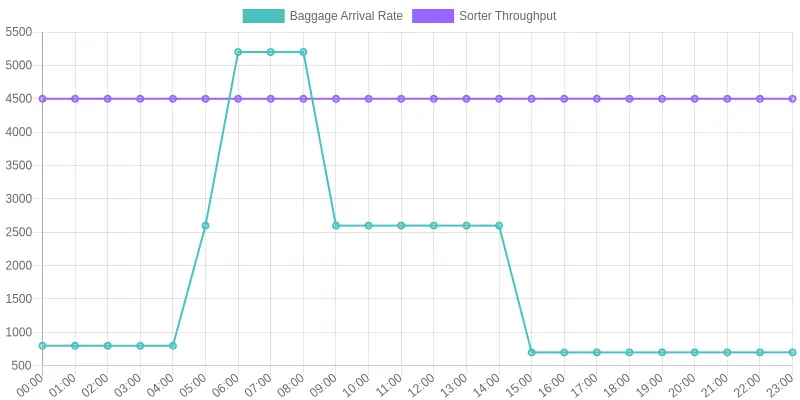
Axes and series: Time of Day on the X-axis (00:00 to 23:00) and Bags per Hour on the Y-axis (0 to 6,000). The solid line is Baggage Arrival Rate; the dashed line is Sorter Throughput (the sorter’s maximum sustainable capacity of roughly 4,500 bags per hour).
How to read the curves:
- Overnight (00:00-04:00): Arrivals stay near 800 bags per hour, well under the sorter’s 4,500 bag/hr ceiling. There is plenty of headroom and no queue growth.
- Morning peak (06:00-08:00): Arrivals climb to about 5,200 bags per hour, roughly 700 bags per hour above throughput. That positive gap is where jams start to cluster.
- Midday (09:00-15:00): Volume settles near 2,600 bags per hour, back below capacity, and the backlog drains.
- Evening peak (17:00-19:00): Arrivals rise again to about 5,400 bags per hour, overshooting throughput by roughly 900 bags per hour — a second jam hotspot.
Wherever the arrival curve sits above the throughput line, the area between them is volume that has nowhere to go but into buffers and queues. That is why the jams cluster in those two windows and not elsewhere.
The gap between the curves is the buffer demand during peak hours: every bag arriving above sorter throughput has to be held until capacity frees up.
Operational Factors Behind Peak-Hour Sorter Surges
The worst congestion on a sorter usually traces back to a few operating schedules that collide.
Flight departure banks. Airlines cluster departures into waves, pushing 15-30 aircraft back within a tight window. Each bank releases its check-in and transfer bags onto the sorter at almost the same time.
Connecting passenger waves. Hub banks feed inbound arrivals whose passengers must recheck transfers. One widebody can deliver hundreds of transfer bags in a few minutes.
Check-in opening schedules. Counters usually open three to four hours before departure and close 45-60 minutes before it, which concentrates bag induction into a predictable band.
Transfer baggage timing. Minimum connect times and late flights push transfer bags onto the belt just before cutoff, adding a sharp secondary spike.
Each schedule looks manageable on its own. Synchronized, they form arrival clusters: overlapping waves that funnel thousands of bags into the sorter within 20-40 minute windows. The demand curve that results has narrow, tall peaks far above average throughput.
Sizing buffers around the peak rather than the average keeps sorters flowing. Teams that ignore these clusters, and the airport ground operations around them, pay for it later.
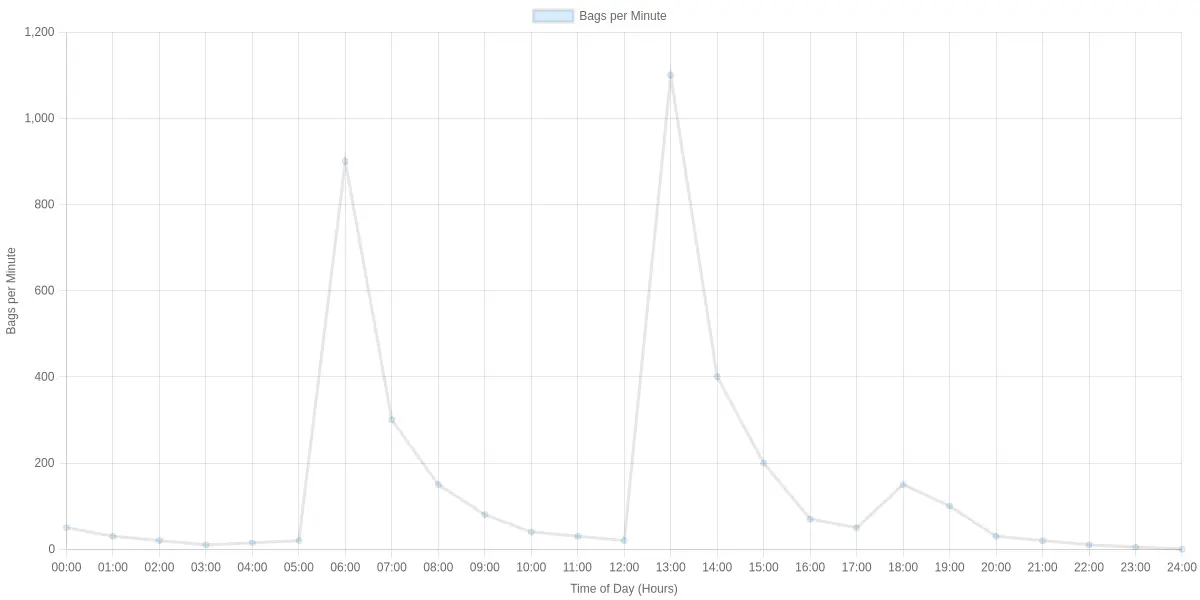
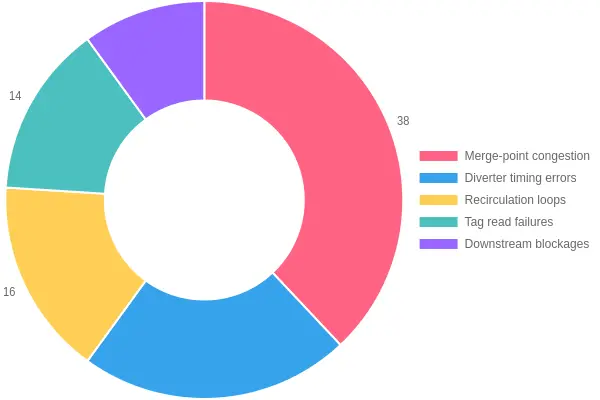
Figure: Merge-point congestion dominates peak-hour jam clustering, accounting for roughly two of every five sorter stoppages.
Sizing a sorter’s buffer should be driven by data, not by guesswork — much like planning around passenger boarding bridge docking faults and downtime cost. Eight measurements turn raw data into a validated capacity figure:
- Measure peak arrival rate: Log bag inductions per minute during the busiest hour across several days to capture true surges, not averages.
- Record sorter throughput: Confirm the sustained transport rate the system actually maintains under load, not its nameplate speed.
- Quantify the gap: Subtract sustained throughput from peak arrival rate to find the excess bags per minute needing temporary storage.
- Estimate surge duration: Measure how long the peak window lasts so you know how long the overflow must be absorbed.
- Calculate surge volume: Multiply the excess rate by the surge duration for maximum accumulation in bags.
- Convert to physical length: Multiply that count by average bag footprint and spacing along the lane.
- Add a safety margin: Apply a 10-20% cushion for variability in bag size and induction timing.
- Validate with simulation: Model the busiest scenario and confirm the queue clears before the next peak.
Airport Resilience Starts with Reliable Systems
A jam does not stay inside the baggage hall. It stresses the same operations that keep gates, stands, and runways moving. A stalled bag belt delays boarding, and those delays compound stand congestion the way passenger boarding bridge docking faults cascade into missed turnaround windows.
Peak-hour jams also compete for the attention and resources that safety-critical equipment gets. Just as top ARFF truck manufacturers engineer airport fire apparatus for reliability under stress, baggage teams can treat buffer capacity as resilience infrastructure rather than spare square footage. Visibility counts too: the reasoning behind why airport fire trucks are yellow is about rapid recognition under pressure, and the same logic applies to fault alarms and sorter diagnostics.
Frequently Asked Questions
Why do sorter jams cluster at peak hours?
Peak-hour jams cluster because demand briefly exceeds the sorter’s designed throughput. When bags arrive faster than diverters, chutes, and merges can clear them, one small disruption cascades into a full stop and drives up downtime costs across ground equipment. Tighter bag spacing at peak also leaves almost no recovery time between scans.
What is buffer capacity in a baggage handling system?
Buffer capacity is the volume of temporary storage a system uses to absorb short bursts of traffic. It decouples upstream induction from downstream sorting, so the line keeps moving even when one section slows or briefly stalls. Think of it as the shock absorber of the baggage handling system.
How do you calculate the right buffer size?
Start with your peak surge volume, subtract steady-state throughput, then multiply by how long the surge lasts. Add a margin for recirculation and re-reads, so the buffer still holds when a bag needs a second pass. That margin is often what keeps a short surge from turning into a stoppage.
Can software controls reduce peak-hour jams?
Yes. Dynamic spacing, load balancing, and predictive jam detection let controls throttle induction before congestion builds. That said, software cannot overcome hard physical limits, so it works best alongside right-sized buffers.
Does a larger buffer always reduce jams?
No. A larger buffer smooths short surges but adds travel time, complexity, and cost, and it can quietly mask underlying bottlenecks. The goal is matching buffer size to your real peak profile, not maximizing storage for its own sake.
Conclusion
Peak-hour sorter jams are not random. They cluster because the arrival rate briefly outruns sorter throughput, and those short overloads compound into congestion.
The numbers point the same way throughout: surge factors rise above steady-state throughput, Little’s Law ties arrival rate and dwell time to the accumulation you need, and the sizing table maps capacity to surge level. Right-sized buffer capacity smooths the peak and keeps the cluster from forming. Match accumulation to your real surge profile and check dwell times under load, as you would with any other airport stand equipment reliability where performance depends on matching equipment to actual demand.
CIMC Tianda has delivered baggage handling and logistics systems worldwide for over 20 years, and has helped operators size buffers against real peak demand.